Philadelphia Eagles vs Kansas City Chiefs Match Player Stats: A Complete Performance Breakdown
Introduction
The clash between the Philadelphia Eagles and the Kansas City Chiefs has quickly become one of the most compelling rivalries in modern NFL history. Whenever these two powerhouse teams meet, fans expect explosive offense, strategic defensive battles, and elite quarterback performances.
From Super Bowl showdowns to dramatic regular-season rematches, their contests have consistently delivered high-level football. This article provides a detailed statistical breakdown of player performances, team comparisons, quarterback duels, rushing and receiving contributions, defensive impact, and overall game analysis.
Game Overview and Context
When Philadelphia and Kansas City meet, the storyline almost always centers around the quarterback matchup: Jalen Hurts versus Patrick Mahomes. Both quarterbacks represent the new generation of dual-threat leaders capable of changing a game through both passing precision and mobility.
In their recent high-profile meetings, including a Super Bowl championship game and a regular-season rematch, both teams demonstrated why they remain among the NFL’s elite franchises. The Eagles showcased a balanced offensive attack and dominant defensive front, while the Chiefs relied on explosive passing and big-play ability.
Super Bowl Matchup: Statistical Breakdown
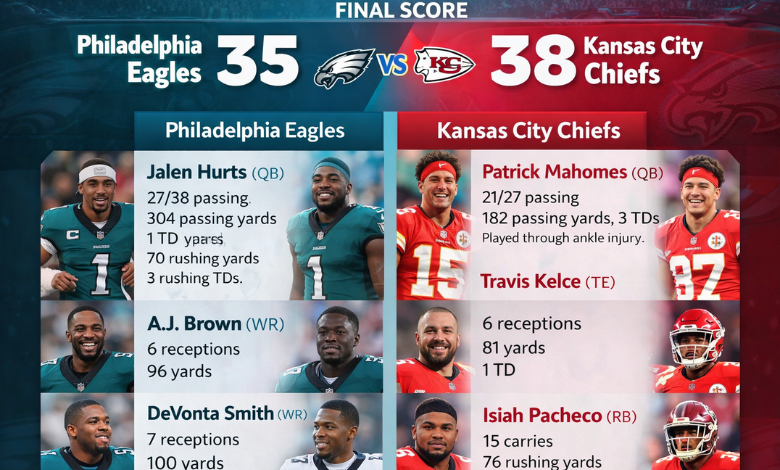
Final Score
- Philadelphia Eagles: 40
- Kansas City Chiefs: 22
Philadelphia controlled much of the contest, especially in defensive pressure and time of possession.
Team Statistics Comparison
| Category | Eagles | Chiefs |
|---|---|---|
| Total Yards | 345 | 275 |
| Passing Yards | 210 | 226 |
| Rushing Yards | 135 | 49 |
| First Downs | 21 | 12 |
| Sacks | 6 | 2 |
| Turnovers Forced | 2 | 1 |
The most decisive difference came in rushing production and defensive pressure. Philadelphia’s defensive line disrupted Kansas City’s offensive rhythm throughout the game.
Quarterback Performance Analysis
Jalen Hurts (Eagles)
Hurts delivered a composed and dynamic performance.
Passing Stats:
- 221 passing yards
- 2 touchdowns
- 1 interception
Rushing Stats:
- 72 rushing yards
- 1 rushing touchdown
Hurts’ ability to extend plays and convert key third downs kept Philadelphia’s offense efficient. His mobility added another layer of difficulty for the Chiefs’ defense.
Patrick Mahomes (Chiefs)
Mahomes displayed flashes of brilliance but faced consistent pressure.
Passing Stats:
- 257 passing yards
- 3 touchdowns
- 2 interceptions
Rushing Stats:
- 25 rushing yards
While Mahomes produced strong yardage numbers, turnovers and defensive sacks limited Kansas City’s scoring consistency.
Rushing Attack Comparison
Eagles Ground Game
The Eagles’ rushing attack proved crucial.
- Jalen Hurts: 72 yards, 1 TD
- Running back unit: contributed over 60 combined rushing yards
Philadelphia’s offensive line created consistent running lanes, allowing the team to control tempo.
Chiefs Ground Game
Kansas City struggled to establish the run.
- Total rushing yards: 49
Without a strong ground presence, the Chiefs became more predictable offensively, enabling Philadelphia’s pass rush to dominate.
Receiving Leaders
Eagles Receiving Highlights
- DeVonta Smith: 69 receiving yards, 1 touchdown
- A.J. Brown: key third-down receptions
- Tight ends: effective in red-zone situations
Philadelphia distributed the ball efficiently rather than relying on one single target.
Chiefs Receiving Highlights
- Xavier Worthy: 157 receiving yards, 2 touchdowns
- Travis Kelce: reliable short and intermediate catches
Worthy’s explosive plays kept Kansas City competitive, even while trailing.
Defensive Impact
Philadelphia’s defense made the difference.
- 6 total sacks
- 2 forced turnovers
- Multiple quarterback pressures
The Eagles’ defensive line collapsed the pocket repeatedly, forcing hurried throws and disrupting offensive timing.
Kansas City’s defense showed resilience but struggled to stop Philadelphia’s balanced attack.
Regular Season Rematch: Player Stats Overview
In a subsequent regular-season meeting, the contest was significantly tighter.
Final Score
- Philadelphia Eagles: 20
- Kansas City Chiefs: 17
Quarterback Stats
Jalen Hurts
- 15 completions on 22 attempts
- 101 passing yards
- 1 rushing touchdown
Patrick Mahomes
- 16 completions on 29 attempts
- 187 passing yards
- 1 touchdown
- 1 interception
The rematch demonstrated stronger defensive discipline on both sides.
Rushing Leaders
- Saquon Barkley (Eagles): 88 rushing yards, 1 touchdown
- Chiefs rushing unit: modest production
Barkley’s performance provided stability and controlled the clock late in the game.
Key Player Comparisons
Hurts vs Mahomes
| Category | Hurts | Mahomes |
|---|---|---|
| Passing Efficiency | High | Moderate |
| Mobility | Elite | Strong |
| Turnover Rate | Lower | Slightly Higher |
| Clutch Plays | Consistent | Explosive |
Hurts’ balanced execution contrasted with Mahomes’ high-risk, high-reward style.
Offensive Strategy Analysis
Philadelphia Eagles
Philadelphia relies on:
- Strong offensive line protection
- Dual-threat quarterback movement
- Balanced run-pass distribution
- Aggressive defensive front
This structure allows the Eagles to dominate possession and dictate tempo.
Kansas City Chiefs
Kansas City emphasizes:
- Deep passing concepts
- Quick playmaking receivers
- Creative offensive schemes
- Quarterback improvisation
When protected, Mahomes can turn any play into a scoring opportunity.
Statistical Trends Across Matchups
- Eagles consistently generate stronger rushing totals.
- Chiefs typically produce higher passing yardage.
- Turnovers play a decisive role in determining the winner.
- Defensive pressure significantly impacts Mahomes’ efficiency.
The numbers suggest that when Philadelphia controls the ground game and pressures the quarterback, they gain the advantage.
What These Stats Reveal
These matchups highlight contrasting philosophies.
Philadelphia thrives on balance and physical dominance. Their ability to run effectively, protect the quarterback, and generate defensive pressure provides stability in high-stakes games.
Kansas City relies on explosive passing and improvisation. When Mahomes connects on deep routes, the Chiefs can score rapidly. However, heavy defensive pressure disrupts that rhythm.
Future Implications
If these teams continue to compete at championship levels, future matchups will likely hinge on:
- Offensive line performance
- Turnover margin
- Red-zone efficiency
- Third-down conversion rates
Both franchises possess elite talent and strategic coaching leadership, ensuring that every encounter remains competitive.
Conclusion
The Philadelphia Eagles vs Kansas City Chiefs matchup consistently delivers elite-level football defined by quarterback excellence, strategic contrast, and physical intensity. Statistical analysis reveals that Philadelphia’s balanced offense and defensive pressure often provide a structural advantage, while Kansas City’s explosive passing attack keeps every contest unpredictable.
These games are not merely regular-season meetings; they represent a clash of modern NFL philosophies. With stars like Jalen Hurts and Patrick Mahomes at the helm, future matchups will continue shaping the league’s competitive landscape.
Frequently Asked Questions (FAQs)
Who performed better statistically in the Super Bowl matchup?
Jalen Hurts delivered a more balanced performance with both passing and rushing contributions, while Mahomes produced higher passing yardage but committed more turnovers.
What was the key difference in team performance?
Rushing yards and defensive sacks gave the Eagles a decisive edge.
Who led in receiving yards?
Xavier Worthy led all receivers with 157 yards in the Super Bowl matchup.
How did the regular-season rematch differ from the Super Bowl?
The regular-season game was closer, featured lower scoring, and showcased stronger defensive adjustments.
What factor most influences future Eagles vs Chiefs games?
Turnover margin and quarterback pressure are the most decisive statistical factors.